UK DIY News
Next: Christmas Trading Better Than Anticipated

Next has published trading data covering the Christmas trading period.
Full price sales during November and December have been better than we anticipated.
- In the nine weeks to 30 December, full price sales1 were up +5.7% versus last year. This was £38m better than our previous guidance of +2.0% for the period.
- We have increased our full year profit before tax guidance by £20m to £905m, up +4.0% versus last year. Of the £20m increase, £17m came from the sales beat to date and £3m comes from an upgraded forecast for full price sales in January.
1. Full price sales are VAT exclusive sales of items sold at full price in Retail and Online plus NEXT Finance interest income. They exclude items sold in our Sale events, Clearance operations and through Total Platform. They are not statutory sales.
Initial guidance for the year ahead:
- Guidance for full price sales on continuous business to be up +2.5%. After accounting for the effect of recent acquisitions, we expect Group sales, including subsidiary companies2, to be up by +6.0%
- Guidance for Group profit3 before tax for the year ahead to be up +5.0%.
2. In this Trading Statement we use the term subsidiaries to include all equity investments including those over which we do not have full control, such as JoJo Maman Bébé.
3. Group profit before tax is not statutory profit. Statutory profit includes (1) an exceptional accounting (non-cash) gain on the Reiss transaction and (2) the minority interests in companies which are fully consolidated in NEXT's accounts (i.e. FatFace, Joules and Reiss). By excluding the minority interests that we do not own, Group profit given here is the profit attributable to NEXT plc shareholders.
This statement is divided into two sections: Part One focuses on the current year, and Part Two gives sales and profit guidance for the year ahead.
PART 1: THE CURRENT YEAR
Full Price Sales to 30 December 2023
The table below sets out the full price sales performance for the nine weeks to 30 December and for the second half to 30 December. The performance in both Retail and Online was ahead of our expectations. Online performed particularly well, which we believe was as a result of service improvements versus last year.
Full price sales (VAT exclusive) versus last year | Q4 to 30 December | Second half to 30 December |
Online | +9.1% | +7.7% |
Retail | +0.6% | +0.0% |
Total Product full price sales | +5.6% | +4.7% |
Finance interest income | +6.7% | +7.0% |
Total full price sales including interest income | +5.7% | +4.8% |
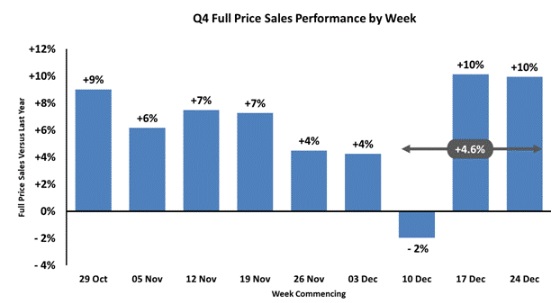
The chart below sets out Q4's weekly performance versus last year. The last three weeks' sales performance was distorted as a result of Christmas Day this year falling after the weekend; so the performance of the last three weeks is best understood by looking at the growth over these weeks combined, which was +4.6%.

End-of-Season Sale
Stock has been well controlled. We went into the end-of-season Sale with -12% less surplus stock than last year. We expect clearance rates over the life of the Sale to be broadly in line with last year.
Sales and Profit Guidance for the Current Year
Our revised guidance for the current year is set out below, along with our previous guidance given in November. Of the £20m increase in profit, £17m came from the £38m sales beat to date, and £3m comes from an upgraded forecast for full price sales in January.
Please note this guidance excludes the exceptional accounting (non-cash) gain of circa £110m following our acquisition of the additional equity stake in Reiss.
Guidance for the full year 2023/24 | Full year guidance | Versus 2022/23 |
| November guidance | Versus 2022/23 |
Full year full price sales | £4.78bn | +4.0% |
| £4.74bn | +3.1% |
Group profit before tax | £905m | +4.0% |
| £885m | +1.7% |
Pre-tax Earnings Per Share | 746.3p | +6.4% |
| 730.2p | +4.1% |
Post-tax Earnings Per Share | 569.9p | - 0.6% |
| 557.7p | - 2.7% |
Cash generation and net debt
Cash generation remains strong in the year and we anticipate that we will generate circa £100m more surplus cash than the previous guidance given in September. This movement is explained in the table below.
Cash flow walk forward: September to January guidance |
| £m (e) |
Increase in profit before tax (£905m versus £875m guidance given in Sept) | 30 |
|
Corporation Tax on additional profit | (8) |
|
Net profit impact |
| 22 |
Cash into the Employee Share Option Trust (ESOT) |
| 25 |
Cash in acquired businesses |
| 25 |
Higher customer payments in the NEXT Finance business |
| 18 |
Other |
| 10 |
Increase in surplus cash |
| 100 |
The cash expected to flow into our ESOT has increased by £25m. This is as a result of more colleagues exercising their share options and purchasing shares from the ESOT, following the recent increase in our share price.
We now expect our net debt (excluding lease liabilities) to close the year at around £700m, which compares to £797m in the prior year.
PART 2: THE YEAR AHEAD
Note on the treatment of brand amortisation:
Going forward we will be excluding the amortisation of the brands we purchase from our headline profits. The rationale for this convention and its effects are set out in Appendix 1 to this document on page 7. For the purposes of comparisons with the current year, we will also exclude amortisation of acquired brands4 from this year's expected number. The effect of this change is to add £10m to the current year's headline profit, taking it to £915m, and £19m to next year's headline profit.
4. Includes the brand and any other related intangible assets acquired in the business.
GUIDANCE FOR 2024/25
A summary of guidance for 2024/25 is set out in the table below. The sections which follow explain our guidance for sales, profit and cash flow in more detail.

Full Price Sales
We have assumed that full price sales for the core NEXT business (Retail, Online, LABEL and NEXT Finance interest income) will be up +2.5% against the current year. This increase excludes any increase in Group turnover relating to the acquisition or growth in subsidiary companies and equity investments.
On the face of it, the consumer environment looks more benign than it has for a number of years, albeit there are some significant uncertainties. The table below summarises the positive factors and risks we have balanced in our sales guidance for the year ahead:
Positive Factors
- Wages rising faster than prices - UK wages look set to rise in line with, if not more than, Consumer Inflation (CPI). For many consumers this will ease the pressure they have felt on their cost of living for the last eighteen months.
- Zero inflation in our selling prices - Cost price inflation in our own products is diminishing, mainly as a result of decreasing factory gate prices. We believe that this will allow us to maintain zero inflation in selling prices5, along with a small increase in bought in gross margins6. This will be the first time in three years that input prices have been stable.
Risk Factors
- Weakening employment market? Although rising wages are good for sales, it seems likely that they will result in reduced employment opportunities in the wider economy. Vacancy rates in the UK have already fallen over the last six months and, if that trend continues, it is likely to result in increased unemployment.
- Mortgage rates? - Fixed rate mortgage deals will continue to expire, and require refinancing at higher rates.
- Supply chain risks? - Difficulties with access to the Suez Canal, if they continue, are likely to cause some delays to stock deliveries in the early part of the year.
5. Price increases are solely assessed on the basis of items that we also sold last year (i.e. like-for-like goods). There is no comparative price for new designs. These like-for-like items account for around 30% of our sales.
6. The difference between the landed cost price of our goods and their original (full price) selling price (VAT ex.)
Total Group Sales
Total Group sales, including subsidiary companies and equity investments, are expected to grow by +6.0%. This turnover figure is calculated using our share of our subsidiaries' turnover. For example, we own 74% of Joules so we include 74% of their sales7 in our top line.
7. This figure excludes their LABEL sales (100% of which are included in our Online sales) and Total Platform commission.
Source : Next PLC
Thank you for the excellent presentation that you gave at Woodbury Park on Thursday morning. It was very interesting and thought-provoking for our Retail members. The feedback has been excellent.


