UK DIY News
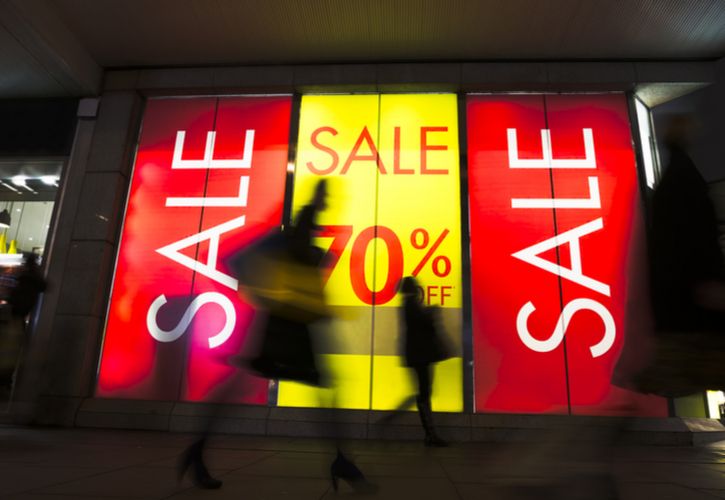
RetailNext Data Shows A Decline In UK Boxing Day Footfall

The latest footfall data from RetailNext Inc., the worldwide expert in retail intelligence and traffic analytics for brick-and-mortar stores, has shown that in-store footfall on Boxing Day was down by -15.3% compared to pre-Covid levels while the Friday-Monday festive period experienced an -18.4% decline in traffic compared to 2019.
The fall in shopper numbers followed reports of a challenging festive period for retailers as rail strikes and travel disruptions, as well as the rising cost of living, created a difficult trading environment for the sector.
The Boxing Day sales are traditionally a big draw for retailers and attract millions of shoppers across the UK. When compared to 2021, in-store footfall on Boxing Day was up by 55.1% while traffic for the Friday-Monday period climbed 30.9%.
Joe Shasteen, Global Manager, Advanced Analytics, commented:
“After a challenging end to the year, a drop in footfall on Boxing Day compared to 2019 will be a blow for retailers across the UK. In the first festive period unaffected by the Covid-19 pandemic, the sector would have been hoping for a bounce in footfall, but rail strikes and the cost of living crisis have compounded to create a hugely challenging time for retailers.
“Despite the return to some kind of normality, which is reflected in the positive traffic trends against 2021, retailers have still had to contend with a huge amount of disruption over December. As the rising cost of living continues to impact the amount of discretionary spend for consumers, this perhaps highlights how important pricing and promotions will be over the next 12 months.”
Store traffic in the South East and London reflected the smallest footfall decline on Boxing Day over 2019 (-8.0%), but was up year over year (+61.2%) for the day. From a category perspective, Clothing and Shoes attracted the highest traffic on Boxing Day compared to 2019 (-6.3%), and was up almost 71% over last year.
RetailNext's full set of preliminary Boxing Day Traffic data includes:
Traffic (2022 vs 2019)
● Friday - Monday, December 23 - 26: -18.4%
Traffic (2022 vs 2021)
● Friday - Monday, December 23 - 26: +30.9%
Regions: Friday - Monday, December 23 - 26 (2022 vs 2019)
● South East and London: - 18.4%
● South West and Wales: - 19.0%
● Midlands: - 22.0%
● North England: - 11.8%
● Scotland & N Ireland: - 26.4%
Regions: Friday - Monday, December 23 - 26 (2022 vs 2021)
● South East and London: +36.7%
● South West and Wales: +25.2%
● Midlands: +20.4%
● North England: +26.3%
● Scotland & N Ireland: +43.8%
Categories: Friday - Monday, December 23 - 26 (2022 vs 2019)
● Clothing & Shoes: - 19.3%
● Electrical & Phones: -25.4%
● Jewellery & Accessories: -24.8%
Categories: Friday - Monday, December 23 - 26 (2022 vs 2021)
● Clothing & Shoes: +49.0%
● Electrical & Phones: +23.3%
● Jewellery & Accessories: +29.4%
*Stores must be open on both the 2022, 2021 and 2019 Date. All 2022 data compared to same date in 2021 and 2019*
(Statistics are subject to change as retailers continue to report updates)
Derived from data collected at thousands of UK stores across multiple brands operating on the RetailNext smart store platform, the data reflects in-store trends across a wide variety of retail segments. Metrics exclude automobiles, petroleum, and warehouse clubs, and include stores across the UK that were open both this year and last year.
Source : Retail Next
Image : Shutterstock.com / 371945593
Insight provides a host of information I need on many of our company’s largest customers. I use this information regularly with my team, both at a local level as well as with our other international operations. It’s extremely useful when sharing market intelligence information with our corporate office.


