UK DIY News
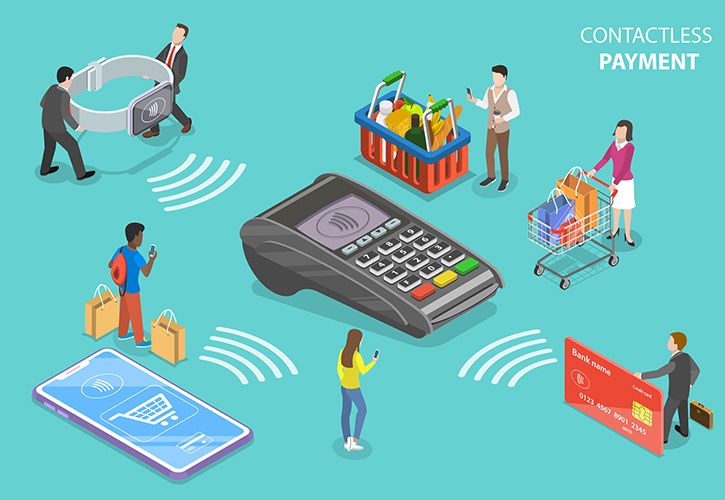
Barclays: Contactless Payment Values Up Nearly 50% In 2022

- Contactless users made an average of 220 ‘touch and go’ transactions last year, totalling £3,327 per person
- A record 91.2 per cent of all eligible transactions were made using the technology
- Mobile contactless transactions above £100 jumped 109 per cent, accounting for 4.1 per cent of all contactless transactions by value
- Northern Ireland and Scotland are the fastest growing regions for contactless usage
- Data compiled from billions of Barclays debit and credit card transactions to provide a comprehensive view of the UK’s changing payment behaviours
The total value of all contactless payments jumped 49.7 per cent in 2022, as Brits embraced the £100 transaction limit and returned to high street shopping following the easing of all coronavirus restrictions.
New data from Barclays, which sees nearly half of the nation’s debit and credit card spending, reveals that a record 91.2 per cent of all eligible card transactions* were made using contactless payments last year – a sign that consumers and businesses are continuing to shift to next-generation technology when buying and selling.
The average contactless user made 220 ‘touch and go’ payments last year, up from 180 in 2021, with the average value per transaction rising 18.5 per cent to £15.13. Even when comparing 2022 against the contactless transactions made at the end of 2021, after the higher £100 limit had been introduced, transaction values were still 5.3 per cent up on 2021’s figures.
Growth in retail, hospitality and leisure
While all sectors saw an increase in the total value of contactless transactions, spending more than doubled in the hotels, resorts & accommodation category (+101.4 per cent). Meanwhile, there was also robust growth in electronics (+97.5 per cent), bars, pubs & clubs (+91.9 per cent), restaurants (+90.5 per cent) and clothing (+82.7 per cent).
The rise of mobile wallets
There was also rapid growth in the value of mobile wallet contactless payments over the £100 card limit. These payments accounted for 4.1 per cent of the total value of all contactless transactions last year, compared to 3 per cent the previous year.
Christmas came early for contactless shopping
As UK shoppers rushed to complete their festive purchases, Friday 23 December was the busiest day for contactless shopping – the total value was 92.1 per cent higher than the daily average during 2022.
For the second year running, the fastest growth in contactless usage came from the over 65s, where the percentage of contactless users rose by 3.8 per cent. Across the UK, the regions with the largest increase in the share of contactless users were Northern Ireland (4.9 per cent), Scotland (4.8 per cent) and Yorkshire and the Humber (2.8 per cent).
Adam Lishman, Head of Consumer Products at Barclays: “The popularity of contactless payments took another leap forwards last year. The higher £100 limit, introduced at the end of 2021, really made its mark as shoppers flooded back to high streets following the easing of coronavirus restrictions, leading to a surge in transactions. Brits are also becoming more comfortable making high-value contactless payments from their mobile, with these transactions accounting for an even greater share of total contactless spend.
“While check-out-free shopping is gradually becoming more prominent, thanks to improvements in mobile technology, in the short term it’s hard to see another payment method competing with contactless when it comes to both speed and ease.”
Category | Contactless Spend Growth in 2022 vs 2021 |
Overall Contactless Spend | 49.7% |
Retail | 42.1% |
Clothing | 82.7% |
Grocery | 35.3% |
Food & Drink Specialist | 16.4% |
Supermarkets | 37.6% |
Household | 54.5% |
Electronics | 97.5% |
Furniture Stores | 77.1% |
Home Improvements & DIY | 45.8% |
General Retailers | 40.1% |
General Retailers & Catalogues | 65.6% |
Department Stores | 55.4% |
Discount Stores | 17.1% |
Specialist Retailers | 57.3% |
Pharmacy, Health & Beauty | 56.5% |
Sports & Outdoor | 75.3% |
Other Specialist Retailers | 51.0% |
Hospitality & Leisure | 64.1% |
Digital Content & Subscription | ** |
Eating & Drinking | 62.8% |
Bars, Pubs & Clubs | 91.9% |
Restaurants | 90.5% |
Takeaways and Fast Food | 34.6% |
Other Food & Drink | 60.7% |
Entertainment | 68.9% |
Hotels, Resorts & Accommodation | 101.4% |
Travel | 58.7% |
Airlines | ** |
Travel Agents | ** |
Public Transport | 51.9% |
Other Travel | 65.3% |
Other | 66.2% |
Fuel | 63.5% |
Motoring | 80.1% |
Other Services | 71.3% |
Source : Barclays
Image : TarikVision / iStockphoto.com (1041046780)
Insight provides a host of information I need on many of our company’s largest customers. I use this information regularly with my team, both at a local level as well as with our other international operations. It’s extremely useful when sharing market intelligence information with our corporate office.


